
Pesticide Sustainability. Do these two words even belong together? I don't know. What I do know is that pesticides are damn expensive and their safety and impact on the environment has been called into question. For these reasons I put a great deal of effort to reduce their use on the golf course.
How do we measure the sustainability of pesticide use? It's complicated. I don't want to get into the costs of cultural control and all that jazz. That is a major focus of this blog after all. What if we look solely at the use of pesticides. How can we improve our current pesticide practices even with all of the crazy insane cultural practices we are already doing?
 |
| Fusarium patch up close and personal |
For the longest time I used the cost and number of applications to gauge my success with pesticide use. Great, but do these things address sustainable pesticide use? Sure, cost is important but the number of applications has almost no impact on the environmental impact and safety of pesticide use other than less applications is less time spent mixing and spraying these products resulting in less exposure risk. That's about it...
Others often use the amount of active ingredient to measure pesticide use. Again, this is only part of the equation when it comes to measuring the impact these products have on the environment.
What we really want to know is how toxic are these products?
 |
| Table 1: Acute Toxicity Comparison |
This is where the Environmental Impact Quotient (EIQ) comes into play.
The EIQ was developed to "organize the published environmental impact information of pesticides into a usable form to help growers and other IPM practitioners make more environmentally sound pesticide choices." It takes factors such as dermal toxicity, chronic toxicity, systemicity, fish toxicity, leaching potential, surface loss potential, bird toxicity, soil half-life, bee toxicity, beneficial arthropod toxicity and plant surface half-life. It can then calculate the Farm worker (golf course worker) risk, Consumer (golfer) risk, and ecological risk of each product. Holy crap! This is EXACTLY what we need!
They have made a handy calculator where you input the active ingredient (AI), concentration of the AI and rate and it gives you the field use EIQ. This is the impact of that chemical at the specified rate on the environment. It takes all of those measurements we have used to compare pesticide use in the past and puts it into a form that we can use to make improvements. This then allows you to compare different products used to control a certain disease.
I have made a table to help me with my pesticide use decision making process. It includes cost per application for label rates to control fusarium patch, and the corresponding field use EIQ for each product.
 |
| Table 2: EIQ for common products and lower label rates for fusarium |
The above chart also shows how a more toxic product can have a lesser EIQ than a product that is less toxic all based on concentration and application rates. Banner Maxx has an EIQ of 31.63 which is more toxic than Quali Pro Iprodione's EIQ of 24.25. After you take concentration and application rate into account we get a field use EIQ of 19 for Banner Maxx and 92 for the Qualipro Iprodione!
TURFHACK: Adjusting the EIQ for spot applications.
The field use EIQ give us a good way to compare different products at specific label rates but does not take into account the overall area that the product is applied to. If I only require a spot application on 100m2 of my 4000m2 putting greens shouldn't this be reflected in the EIQ? Surely spot applying should have less impact on the environment. To adjust the EIQ for you records you can do the following:
Area Spot Applied / Total area being treated (greens, tees, fairways) x EIQ for product applied and rate.
This gives a better representation of the overall impact of spot applications used to control a specific pest on a specific area of the golf course. It is important to remember that the EIQ is still the same for those small areas being spot treated. The Worker EIQ is still the same and the same precautions should be taken as when broadcast spraying larger quantities of pesticide.
Measuring Pesticide Cost
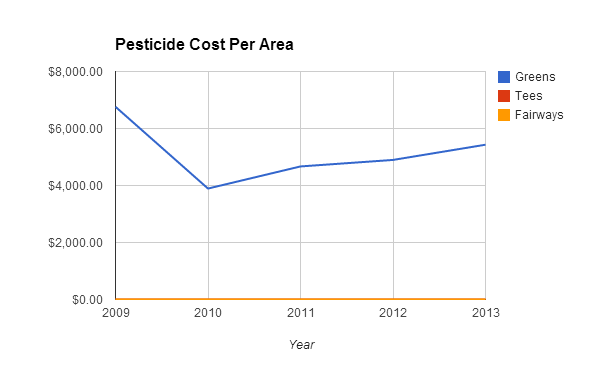
I start by seeing what parts of the course cost the most in pesticide use. I do this mostly to make myself feel good as the only areas that require pesticides are the greens. As time goes on and expectations change we will be able to look back at this data and see if the changes were worth it.
For each area that receives pesticides we can then break down costs to type of pest. Disease, weeds, and insects. At Pender Harbour I only need to treat for disease. The following table shows how we can break down the cost by disease for the putting greens.
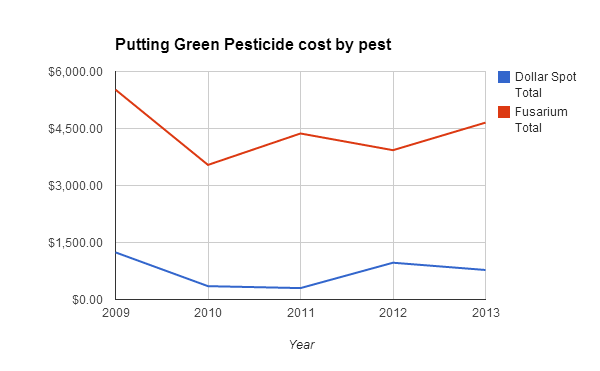
Right away we can see that the majority of my pesticide expense is spent fighting fusarium. Costs of controlling disease will vary year to year unless you are on a strict fungicide rotation. For me I apply on an as-need basis so the costs vary depending on disease pressure.Measuring Pesticide EIQ
Until now I have not taken the EIQ into account as it is a relatively new concept. Perhaps measuring past pesticide applications in a similar way that we measured pesticide costs will give us a good starting point for setting goals for the future. Tallying the EIQ after each year will give you a good idea of the total EIQ to control each pest. It is really hard to make these predictions before hand as so much depends on the weather.

It is important to note the the EIQ for Civitas has not been accounted for as there is no good EIQ AI data as of yet. The EPA and PMRA consider it organic and to be one of the least toxic pest control products (ld50 >5000mg/kg) but the EIQ only has oil as an AI which gives it an EIQ similar to Chlorothalonil! Until an EIQ that better reflects the products hazard is release I cannot include it in my calculations. The calculator also doesn't have a means of measuring bacteria so I haven't included Rhapsody ASO either. As it stands data for the "organic" products is rather poor.
The EIQ for Dollar spot has never been above 27 and for the past 2 years has been controlled completely with cultural practices, Civitas, and Rhapsody ASO. Again, until I get better data for the organic products I cannot present that data. Essentially, most of the EIQ on the greens is accumulated by using products to control fusarium patch.
Analysing the data
Going forward if I want to make change I need to look into where the majority of the EIQ is coming from. In Table 2 I can see that the products that have the biggest EIQ were Daconil. Quintozene also had quite a high EIQ but hasn't been registered for use since 2010. In the following table I have singled out the EIQ for these products to see just how big of an impact on EIQ they are having.
| EIQ Adjusted for Spot Apps | 2009 | 2010 | 2011 | 2012 | 2013 | Average |
| Total Yearly EIQ | 1286.38 | 648.65 | 792.94 | 1130.25 | 885.41 | 948.73 |
| Daconil | 0 | 413.2 | 939.44 | 585.45 | ||
| Quintozene | 833.41 | |||||
| Resultant | 452.97 | 648.65 | 379.74 | 190.82 | 299.96 | 394.43 |
| % EIQ | 64.79% | 52.11% | 83.12% | 66.12% | 66.53% |
In 2012, Daconil accounted for 83% of the total EIQ of traditional pesticides on the putting greens! In 2013 it was 66%. This is a big impact especially seeing that no more than 2 applications at the lower label rate for fusarium were applied! A single application of Daconil at the upper label rate for fusarium has a field use EIQ of almost 620! Again, there is no real pattern here as until now I hadn't measured the EIQ.
I'm not saying that Daconil is bad. It just has a larger environmental impact than other products. If my goal is to reduce this impact, I need to focus on those products that have a high field use EIQ.
Improve
Now that I have become aware of where my pesticide costs and environmental impacts are coming from I can set some realistic goals to become more sustainable. I have decided to keep my cost goals around the average I have spent over the past few years. I have reduced the EIQ goal by about 15% from average. If I can manage fusarium with products with a lesser EIQ and keep costs the same I should be able to get the EIQ down by at least 50%. I want my goals to be achievable and will strive to get all the numbers as low as possible. So much depends on the weather.
 |
| Table 4: Pesticide Use Goal Tracking |
I have created a table which automatically tallies my progress towards my goals and compares them against how much time has elapsed YTD. As you can see I have already overspent on pesticides for fusarium control but if I have make it another month without the need for an application I will be right on track. As far as EIQ goes, I am well ahead of the game and if I can make it another month without an application I will be almost 10% ahead of my goals for the year.
Pesticide use is a complicated thing to measure. With the proper tools and measurement techniques we can make more informed decisions and make a real difference when it comes to pesticide use reduction and sustainability. It's not just about the toxicity of these products compared to other things, it is about reducing any possible impact as much as we possibly can. There are many ways to measure pesticide use but I hope that this post helps show how you can make the biggest impact by tracking cost and EIQ.